

We see a lot of OEE systems going in but failing to deliver value that they could. The software itself is rarely the problem. The problem is usually the set-up, and the root cause of a poor set-up is usually how well people understand what OEE is and how it should be used to deliver the maximum benefit (oee.com is a great resource on this, with one caveat I'll come to at the end).
The same three mistakes come up again and again, and I'll take them in turn below. Between them they hide what we see is often the biggest opportunity (and most politically contentious) on the site, and I'll come back to why that one matters so much.
For clarity, when I say OEE (overall equipment effectiveness) in this article I mean the efficiency number the system reports, set up the way most sites set it up. In the third section I'll describe a different measure, OOE (overall operations effectiveness), which uses a different denominator, and I'll say why we prefer it.
1. Measuring, and focussing on the wrong thing
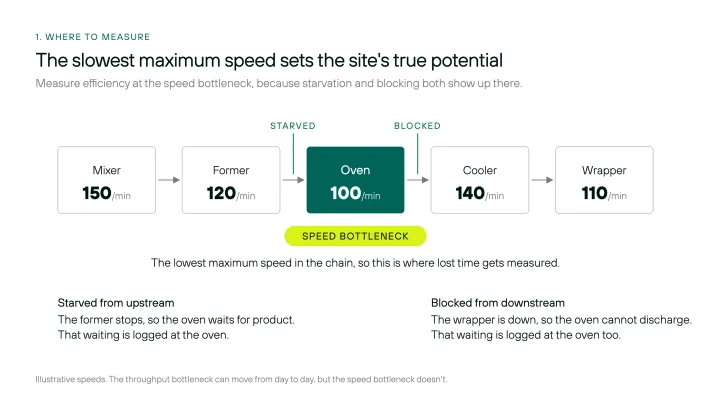
The first thing we see going wrong is that people measure (and focus on) local efficiency on an asset that isn't the bottleneck. Often every machine gets its own performance screen and its own efficiency number, but improving a machine that already has spare capacity doesn't change what the site can make (though granted, there may be some local cost saving opportunity there).
In any process the asset to measure is the speed bottleneck - the one with the lowest maximum speed - because that is the machine that sets the true potential of the site. So that is where you measure efficiency, and that is doubly important if you need more throughput. If it's cost saving you want, more throughput means you can run the whole site or process with fewer hours and as such not only use fewer direct hours, but also improve recovery of overhead, rather than saving a few hours here or there on non bottleneck processes.
The throughput bottleneck on any given day might well be somewhere else, and that's fine. If a machine upstream keeps stopping, the speed bottleneck gets starved, and you'll see that as waiting time at the speed bottleneck. If the machines downstream can't take what it makes, it gets blocked, and you'll see that at the speed bottleneck too. Good efficiency systems capture this as causal downtime, logged against the machine that caused it. In most cases that's overkill. Logging the waiting time at the speed bottleneck, and noting whether it was starved or blocked, is enough to tell you where to look. Measure somewhere else and you end up fixing the wrong thing.
2. Using the wrong speed target to define OEE
The other big issue is that bottleneck speeds are not set correctly. The bottleneck speed should be the maximum design speed of the slowest process in the chain. What often happens is that the maximum speed gets conflated with the target run speed, so the system calculates OEE and reports slow running against the current operational target. The gap between the target and what the machine can physically do is hidden - this is the main source of 'lost potential'...
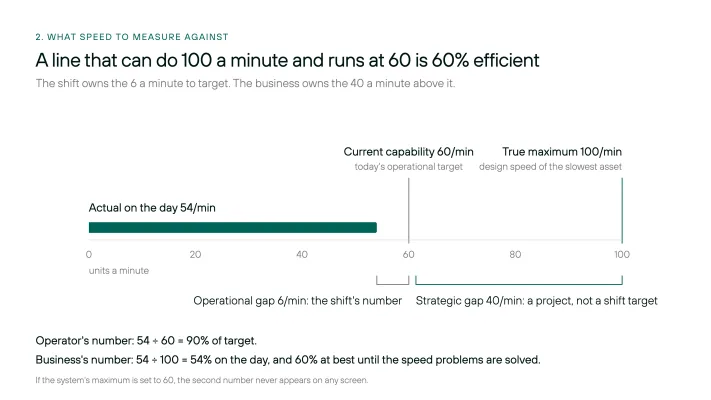
Take the following example: a machine that can do 100 units a minute, and a process whose current technical capability is 60.
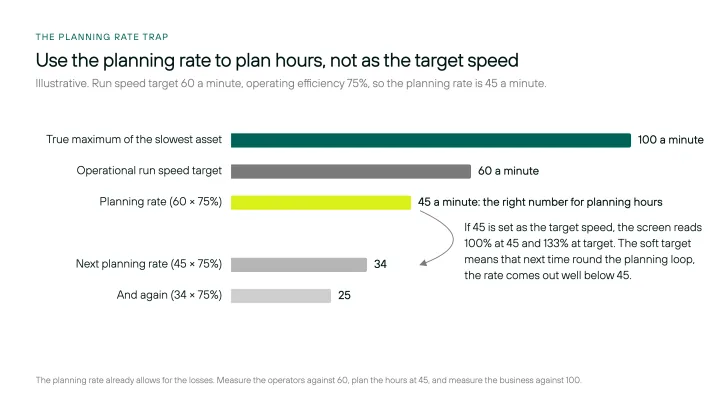
If the targets are: a run speed of 60 and an in-run efficiency of 75% and the operators achieve net rate of 45: the screen goes green. This is not true OEE.
In some cases, we've seen the target speed in the system set to the planning rate. The planning rate is the target run speed multiplied by the in-run efficiency you expect (call it operating efficiency), and it's the right number for the planners to use when they work out how many hours a job needs.
So in our example: an operational run speed target of 60, an operating efficiency of 75%, and a planning rate of 45 a minute. That is fine as a planning number. The trouble starts when somebody uses the 45 as the target speed. Now the system reads 100% when it's running at 45, and 133% when at 60...
The losses that the 75% was there to allow for are being allowed for twice, and when the planning rate is next worked out from actuals (assuming the operation sandbags because it's allowed to) it comes out well below 45. We see people use the planning rate as the target speed more often than you'd think, and it leads to a horrible negative feedback loop.
It's also worth saying that quite often nobody on site actually knows what the design or maximum speed is. It has never been achieved, so nobody talks about it, and over the years it drops out of the conversation altogether. It becomes an almost ethereal concept: the number on the nameplate that nobody has ever seen the line do. So getting to the bottom of what the machine is genuinely capable of is a crucial first step, and it usually takes some digging (the manufacturer's spec, the commissioning records, the best hour anyone can find in the data, and a speed trial).
Once you have the true bottleneck speed, the set-up itself is simple. Record whatever speed the line is actually running at, and present slow running as lost time:
Lost time slow running = Good output ÷ average run speed − Good output ÷ bottleneck speed
That second term (good output divided by the bottleneck speed) is the potential time, which is how long the good output would have taken if the line had run flat out. Everything above that is time you have lost, and once it's in hours you can put a value on it.
3. Dividing by the wrong denominator
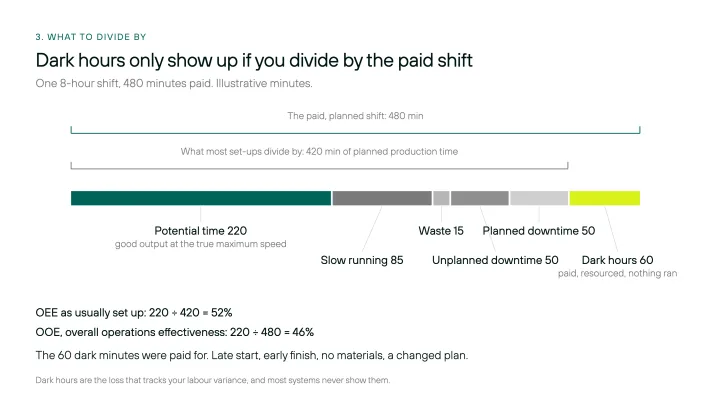
The third thing that gets missed is what I'd call dark hours: the line is resourced, the people are there and could run it, but there's nothing to do. A late start, an early finish, no materials, a plan that got changed. In most set-ups those hours just drop out of the denominator, so the efficiency for the shift looks fine even though you paid for eight hours and ran for six.
The denominator should be the planned hours that you resourced the line to run. We call the resulting measure OOE, overall operations effectiveness, and the only difference from OEE is the bottom of the fraction. OEE as usually set up is potential time divided by the time the line was planned to produce. OOE is potential time divided by the paid, planned shift time, so the dark hours stay in.
The reason it matters is that OOE correlates far more closely with your labour variance than OEE does. You can have a very high OEE and a poor labour variance at the same time, if the work you did do was efficient but planning problems, over-resourced lines (in line-hour terms, rather than more heads than standard) or a lack of materials meant you didn't run what you'd planned. Those losses often go missing.
What to do about it
The pushback on all of this is predictable. If the machine can do 100 a minute and the process can currently only manage 60, nobody wants the operators measured against a number they can't hit. That's a fair concern, but the answer isn't to hide the 100. The answer is two different numbers, measured and analysed in two different ways.
Strategically, the business should be looking at its speed loss against the maximum, 100% speed. Operationally, day to day, the operators should be measured against their ability to hit the current target, which may well sit under the bottleneck speed because the business hasn't yet solved the problems that stop the line running faster.
Importantly, the OEE (or OOE) number itself should always be reported against the 100. The local speed target sits underneath it as a sub KPI: did the operators hit their current speed target today? And because the two are linked, the operators' OEE target for the day follows from it.
In the example, assuming no downtime and no waste, the process efficiency is 60%, so a target of 60 a minute means a 60% OEE target for the shift. If we're expecting 25% of losses against the 60 from stops and waste, it's a 45% target. The operators are aiming at a number they can hit, the business can still see the 40% (or 55%) that's missing, and in the background there should be a project to get the speed up from 60 towards 100 (assuming that's the biggest source of absolute lost time).
There's one more reason to keep the true speed separate from the target. If the target speed is also the number your OEE trend is measured against, then every time the team improves and you raise the target, and if the history isn't restated, OEE appears to get worse for improving. My sense is that's why some people simply never update it. A true bottleneck speed in the background doesn't have this problem.
Why slow running is usually the biggest opportunity
Slow running tends to sit at the top of the Pareto of losses for a simple reason: it's the hardest and most complex loss to fix, and is also the most emotionally charged. So it's the one that is still there after everything else has been tried.
First of all you have to admit that there is potentially 66% more throughput potential (extending the 60->100 example) and secondly, when you turn a line up, things break. A seal that held at 60 a minute starts leaking at 70. A depositor that was accurate at 60 starts giving product away at 75. Short stops that were occasional become constant, and the operators quite reasonably turn the speed back down to where the line behaves. So the speed itself becomes the constraint. Because the fix usually means solving three or four technical problems at once, and each of them only shows up above the current speed, the business settles at the speed where the line is stable and the target gets set there. The maxim 'slow and steady' is often touted. The other favourite: 'you wouldn't drive your car at its max speed'. Well, I would if it had been MOT'd, well serviced and I was being paid for the distance I could travel in a certain amount of time.
The speed-output chart below is the one we use on every speed trial. You step the speed up in small increments, stay at each one long enough to get a decent sample, and record output, waste and every stop. Good output tracks the speed until the first problem appears, and then it drops. Solve that problem properly and output comes back, so you step up again until the next one appears. Today's target usually sits at point 1, where the line behaved before anyone pushed it, and that is the right place to run today. The point is that point 1 isn't fixed.
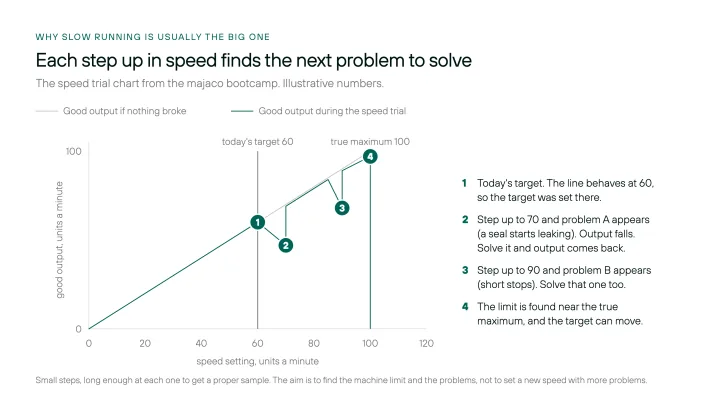
That is what the strategic project actually is: a speed trial to find the machine limit (not a new speed with more problems), then proper technical problem solving on each thing that breaks, to root cause rather than with a workaround, before the target moves up. Then do it again. It's slow, technical work, and in our experience it's usually where the money is.
The gap is usually bigger than people think. It often takes months of technical problem solving to push run speeds past the previous best, and we're frequently told by the equipment manufacturer that it can't be done (their incentive is to sell new kit, so this makes sense). Sometimes we exceed nameplate altogether: a bagging machine taken to 115 a minute against a design speed of 100 and a previous best of around 80, sausage machines pushed past nameplate by tweaking the PLC code, and a 60% cut in cycle time on popcorn kettles after we found the thermostat was sat too close to the elements and reading the wrong temperature. None of those would have been pursued without a true bottleneck speed to put a value on the gap. Most organisations never make these breakthroughs, through a lack of belief, capability and time.
Where I have landed on this (a personal view)
There is a tension here between accuracy and correctness of measurement vs engagement on the shopfloor. As an OEE purist, the answer is simple: set the maximum speed to the true bottleneck speed and let the number be brutally honest: (that is what OEE is for. It's meant to show you where the opportunities are, and it's about constant improvement, not having a big number.)
But, the source of long debates about this, internally and with clients, cannot be ignored: Operators don't want to be well below their 'blue line' every day - which I totally understand. It's demoralising, and it doesn't give them any clarity on what's expected of them.
So - lots of people (me included) will confidently say the maximum should be the true bottleneck speed, but concede the set-up that gets the best engagement, because engagement actually matters more - at least in the short term. In the absence of an alternative, a stretching but achievable target on the line is the right call. What I don't accept is that the true number then has to disappear.
That's why I think the right answer is two variables: a true bottleneck speed, and a local target run speed set by line and SKU variant (with a companion OEE target to go with it). It's a trade-off between engagement and utility, and most systems only give you one or the other. Where the software doesn't support it, we've built it ourselves, by borrowing an unused field in the background, rebuilding the reporting layer and in some cases building the system ourselves. It is worth the effort, because it often uncovers the biggest single financial and capacity opportunity on the site.
In summary
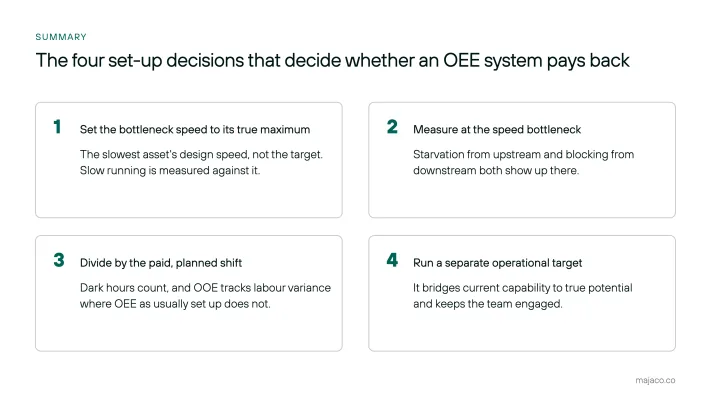
- Set your bottleneck speeds to their true maximum.
- Make sure you're measuring the right step in the process (the speed bottleneck), and understand what starvation and downstream blockages are doing to it.
- Use the paid, planned shift time as the denominator, which turns OEE into OOE.
- Have a separate operational speed target that bridges the gap between current capability and true potential, so as not to disengage the team - but be very clear with yourselves what the true potential is and where you should be focused.
Which machine is your OEE screen pointing at, and does anyone know its true maximum speed? Let me know what you think. And if you'd like some help working all this out - please get in touch - makeitpossible@majaco.co
A note on oee.com
I pointed at oee.com at the top, so I should say that at majaco we don't use the Availability × Performance × Quality method it teaches. Multiplying three percentages together tells you how big the number is, but it hides where the time went in absolute terms. We work in lost time instead: every lost hour is allocated to one cause (downtime, slow running or waste), the hours add up to the gap between what the line made and what it could have made at the true bottleneck speed, and each one can be valued in pounds. That is what lets you rank the losses and go after the biggest.
What oee.com is very good on is the psychology. Why OEE exists, what a green number does to people, and why the point is to find losses rather than to post a big percentage. That part I'd recommend to anyone setting a system up.